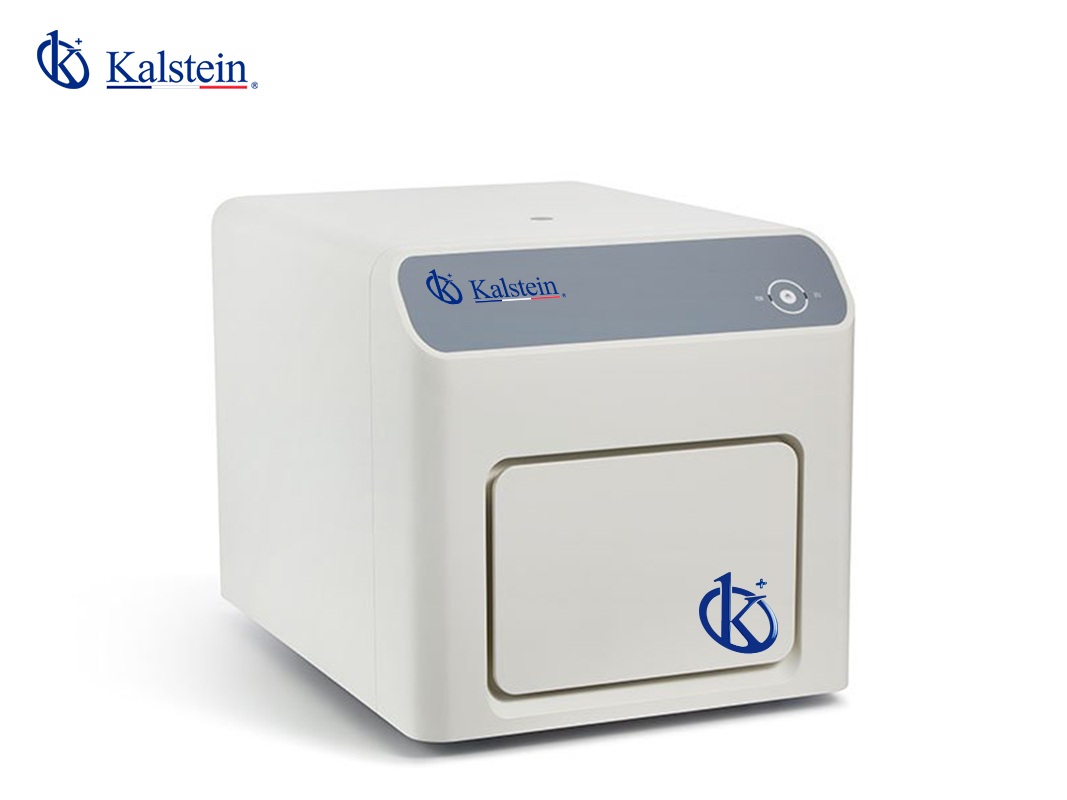
How to Interpret Results and Read Measurements with the YR06248 Real-time PCR System
The YR06248 Real-time PCR System is an advanced tool designed to perform PCR analysis with high precision and sensitivity. Understanding how to interpret results and read measurements is essential for laboratory professionals utilizing this system, as it can significantly affect research outcomes and diagnostic accuracy. This article delves deeply into the interpretation of results and the reading of measurements obtained from the YR06248.
Understanding the Basics of PCR and Result Interpretation
Polymerase Chain Reaction (PCR) is a technique used to amplify DNA, making it easier to study. The YR06248 employs a quantitative real-time PCR approach, which allows for the monitoring of DNA amplification in real-time. This method is particularly useful in applications requiring precise quantification of genetic material. The key to effective result interpretation lies in understanding the underlying principles of PCR and how they pertain to the data generated by the YR06248.
Key Features of the YR06248 that Aid in Interpretation
The YR06248 is equipped with several advanced features that enhance its capabilities in result interpretation. For instance, its Peltier heating and cooling technology ensures precise temperature control, which is vital for effective PCR performance. Additionally, the system supports multiplexing with configurations of up to 5 channels, allowing for the simultaneous analysis of multiple targets. Understanding these features is essential for accurately interpreting results.
Reading Measurement Outputs from the YR06248
The YR06248 generates various measurement outputs, including amplification curves, threshold cycles (Ct), and quantification data. To effectively read these measurements, one must be familiar with the graphical representations displayed on the system’s interface. Amplification curves show the relationship between the threshold and the number of cycles, indicating when the target DNA is detectable. Understanding how to identify and analyze these curves is crucial for accurate data interpretation.
Common Misinterpretations and How to Avoid Them
Interpreting results from the YR06248 can lead to misinterpretations if users are not careful. Common pitfalls include confusing baseline noise with actual signals, misreading the Ct values, and overlooking the significance of the amplification curve's shape. To avoid these errors, it's important to familiarize oneself with the expected patterns and behaviors of PCR results, ensuring a more accurate interpretation.
Worked Examples of Data Interpretation
To illustrate correct data interpretation, consider the following example: a researcher conducting a study on gene expression levels. After running the YR06248, the amplification curves indicate that the gene of interest has a Ct value of 22.5 in sample A and 30 in sample B. This suggests that sample A has a significantly higher expression level than sample B. Providing such worked examples can clarify the interpretation process and enhance understanding.
Technical Specifications of the YR06248
| Specification | YR06248 | YR06249 |
|---|---|---|
| Model | YR06248 | YR06249 |
| Sample Capacity | 8 × 0.1mL PCR strip; 12 × 96 × 0.1mL individual tubes; 0.1mL PCR Plate | 8 × 0.1mL PCR strip; 12 × 96 × 0.1mL individual tubes; 0.1mL PCR Plate |
| Sample Volume | 10-50 µL | 10-50 µL |
| Heating/Cooling Method | Peltier | Peltier |
| Temperature Range | 4-100 °C | 4-100 °C |
| Maximum Ramping Rate | 6.0 °C/s | 6.0 °C/s |
| Sensitivity | 1 copy of the gene | 1 copy of the gene |
| Dynamic Range | 10 orders of magnitude | 10 orders of magnitude |
Frequently Asked Questions
What is the sensitivity of the YR06248 Real-time PCR System?
The YR06248 is capable of detecting as low as one copy of genetic material, making it highly sensitive and suitable for low-concentration samples.
How do I interpret the amplification curves generated by the YR06248?
Amplification curves show the relationship between the cycle number and the fluorescence signal. The shape of the curve indicates the efficiency of the PCR process and allows for the determination of the threshold cycle (Ct) values for quantification.
What are common mistakes when reading the measurements from the YR06248?
Common mistakes include misinterpreting the baseline noise as a signal, not recognizing the significance of the Ct value, and overlooking the curve's shape. It's important to train on expected results to minimize these errors.
How can I ensure accurate temperature control with the YR06248?
To ensure accurate temperature control, regularly calibrate the system, utilize high-quality reagents, and follow the manufacturer's recommended maintenance procedures.
What is the expected lifespan of the YR06248?
The YR06248 has a long operating life with proper maintenance, typically lasting for several years. Regular servicing can enhance its lifespan and maintain optimal performance.
How do I request a quote for the YR06248?
You can request a quote for the YR06248 by contacting our sales team or through our official channels for an accurate pricing estimate and available discounts.
If you are looking for a fusion of innovation and quality, you have come to the right place. At Kalstein, we offer you the luxury of exploring our exclusive catalog of laboratory equipment. We manufacture every device to the highest standards of excellence. Our intuitive and seamless online purchasing channels are designed for your convenience, securing the most competitive prices. Hesitate no longer — we bring science to life, it is time to become part of our community.